Support and Resistance are they the same?
Support and resistance are shown as horizontal or angled lines. Cryptocurrency prices tend to rebound after a period of decline when a support price level is reached. Usually, at this point, buyers start finding the price attractive enough to buy as the seller is less willing to compete, preventing the price from falling further. It is a sign of growing bearish sentiment when the support level doesn’t hold and the cryptocurrency price continues to tumble.
Support and Resistance Levels: How to Find Them?
The Highs and the Lows
An analysis of highs and lows within a specific period is one of the most commonly used methods to find support and resistance indicators. Price points at which maximum gains were made during a rally are shown by the highs. When the price drops in a downward trend, the lows mark the lowest price.
Whenever an asset observes the same lows and highs, these are considered strong support and resistance levels.
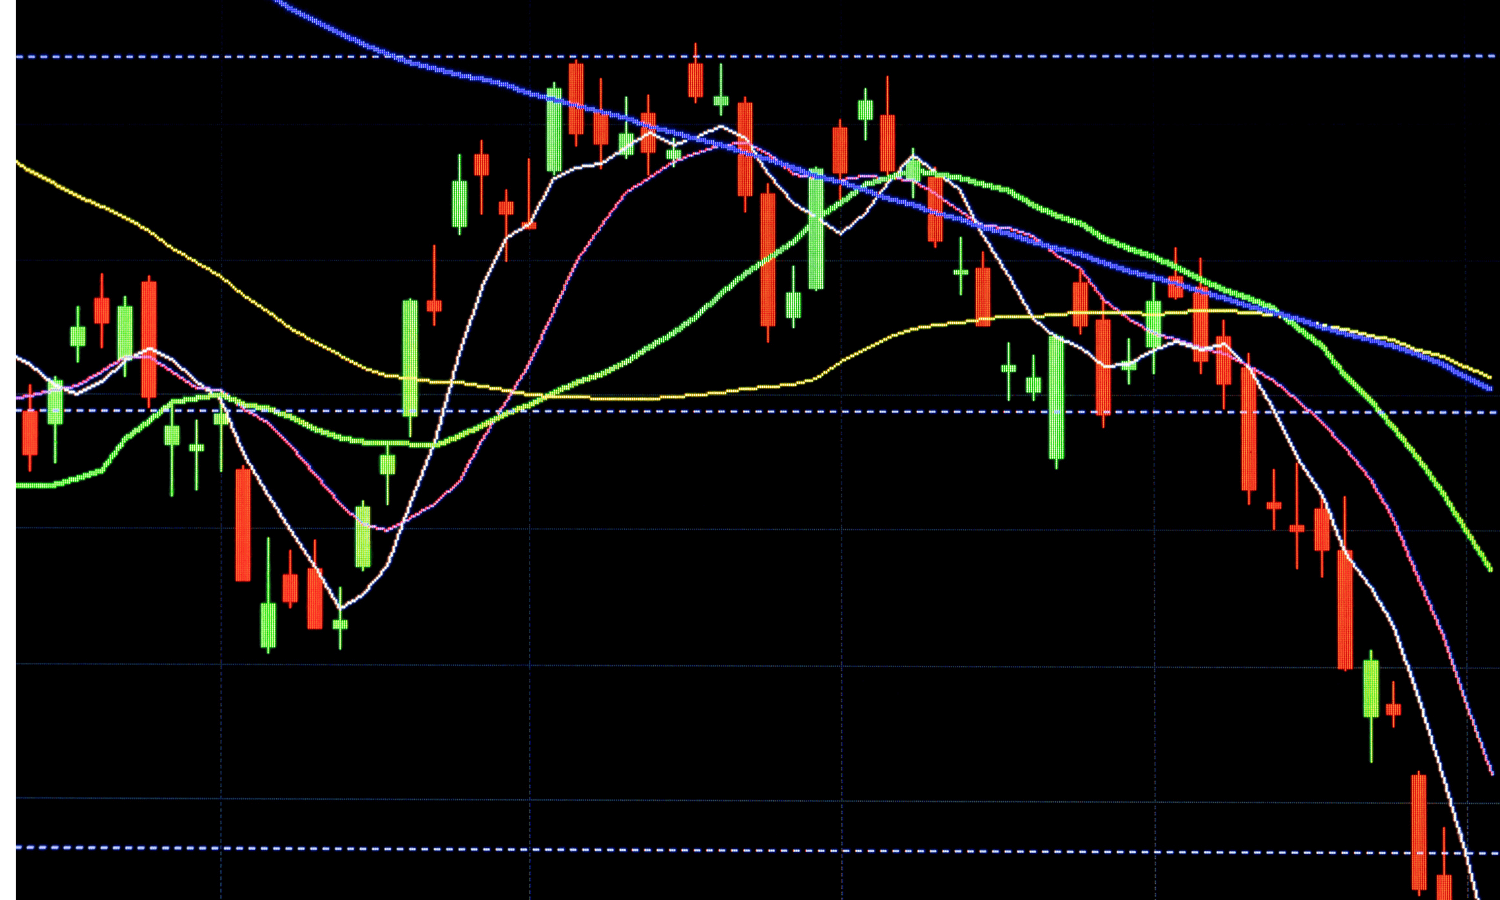
Index of Moving Averages
Support and resistance can also be found using the moving average (MA) indicator. Traders use moving average indicators to identify short-term, medium-term, or long-term support and resistance levels. It includes 10 days, 20 days, 50 days, 100 days, and 200 days moving averages.
The use of moving averages in crypto trading reduces market noise. Longer moving averages for long-term investors, however, suit traders seeking quick profits more than shorter moving averages (10, 20, 50).
Index of Trendlines
Except for sloping lines, the trendline indicator looks pretty much like what we see on horizontal support and resistance charts.
To trade successfully, what else should you know about Support and Resistance?
Support levels and Resistance levels can also be classified as major and minor. Even though prices might bounce around a bit, they often drop through minor levels.
We could determine whether the trend continues or a price range is developing based on the behavior of the cryptocurrency around the minor levels. Support and resistance levels mark the areas where trends reversed. Market participants tend to use round numbers as psychological support and resistance levels, such as 5, 50, and 100.
Technical analysis can accept the lines slightly below or slightly above the price picks, as long as the asset trades above the support/resistance level. Cryptomarkets are particularly volatile in this regard. In these situations, drawing support and resistance zones rather than lines is often a better strategy. Using previous lows as support, and previous highs as resistance, we can map out the support and resistance zones. While zones are best suited for long-term trading, specific levels are most suitable for short-term trading.
A crypto asset’s price moves within a trading range when supply and demand are evenly balanced, and there is little volatility. When a trend changes, bulls or bears have finally won the battle.
The crypto trading strategy is to buy slightly above the support level in uptrends and sell near the resistance level in downtrends based on support and resistance levels. The support and resistance are not guaranteed to hold. Take the extra step of waiting for the confirmation of trends. You can also use other indicators to confirm trend direction with support and resistance levels.
Supports and Resistance as Trading Tools
Developing a better trading strategy is important: Crypto trading is known for its notoriously high volatility. An investor without a strategic approach may suffer significant losses at first. These levels help traders design trading strategies that counteract market volatility to increase their profits. Based on facts, make the most logical decisions.
Any crypto trader should be aware of market trends. Market trends are revealed by support and resistance levels. The right time to enter a crypto futures trade could translate into significant profit potential for traders.
The support and resistance indicators provide traders with crucial entry and exit points. Identifying an opportunity in trade is crucial to entering and exiting a trade successfully. The use of long-term DMs (100-, 200-day) is also common among traders.
They can serve as effective risk management tools. As an example, a trader with a long position can open a stop-loss just below the support level, which will help prevent drastic losses if the market goes down. In the same way, a trader holding a short position near a resistance level will experience the same outcome.
Risks Associated with Trading Support & Resistance
False breakouts: It is quite common for crypto prices to go slightly above the resistance level or below the support level, only to retract to the levels later on. As a result, novice traders may feel a bit confused.
Further, a trader can set a short order following the resistance level if the entry support price falls below the stop-loss level; false breakouts can cause substantial losses. Crypto traders must use these indicators with caution when they are new.
Support and resistance levels are difficult to establish: Identifying the levels of support and resistance is not an easy task. A beginner may find it difficult to determine the level of precision that is optimal. Investing with inaccurate indicators may result in significant losses or, in the worst-case scenario, asset liquidation.
Final thoughts
Trading tools such as support and resistance levels are crucial to a trader’s toolbox. It’s a place where a lot of signals and trading takes place, and the setups tend to be simple with a high winning rate. A cryptocurrency’s price is ultimately determined by the interaction between buyers (demand) and sellers (supply) and is often determined by behavioral factors (human psychology). altFINS’ platform provides trade setups for support and resistance levels.
